Table of Contents
1. Summary
Excel is indeed a complicated software to master. However, with the right skill set and know-how, you can become an Excel expert and earn money by providing services like formatting data or creating spreadsheets and charts. To have a successful career as an Excel Expert, you need to have skills in various areas like Microsoft Excel and Windows applications.
You must be creative and know different business sectors. Learning Excel from various online free courses and tutorials can be a good way to start.
a. Who is an Excel expert, and how to become one?
Excel is often considered the most widely used spreadsheet in the world. It is easy to use and an integral part of any business. If you are interested in a career as an excel expert, then there are several skill sets that you need to develop. First, you must learn how to use formulas, spreadsheets and create graphs with Excel.
Becoming an Excel expert might help if you have a degree in accounting or finance. But if not, it is still possible to become one by learning Excel online on your own time over time while working a full-time job. Excel experts have many roles like managing large spreadsheets, analysing data, making statistical models, designing graphical reports etc.
The easiest way to start Excel is to learn the basics of it. Then, the best way is by watching tutorials on how to use different features of Excel. Another way to start Excel is by using the templates that are available online; these templates have all the necessary tools for you to create a workbook or even a database.
b. Top 10 skills you need to master to become an Excel expert and earn money.
With the growing demand for Excel experts, you need to gain enough skill sets to thrive in this field. Excel is an important tool that can be used for many purposes. It can be used to grow your business, make your job easier, and even earn some extra money. If you’re looking for a career in Excel and earn money, these are the skills you need to master.
c. Be able to create pivot tables.
Creating pivot tables is an essential skill for any data analyst and excel expert. Therefore, knowing how to create pivot tables is a key professional element. Pivot tables are used in almost every stage of your data analysis and are used by the most seasoned professionals. They allow you to view the data more compactly, including summarising and providing comparisons.

What’s more, they allow you to manipulate your data using every type of function that Excel offers. This makes them very powerful in many cases – especially when combined with other Excel functions like VLOOKUPs or IF statements.
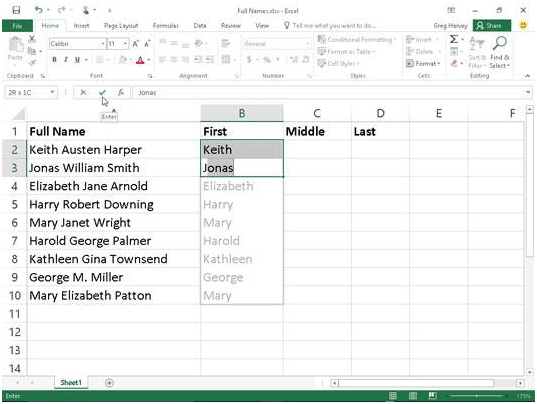
d. Flash Fill
Ms Excel’s Flash Fill feature helps you save time and effort by automatically completing your data fields. You can also use it to create a range or a list in one go. The neat thing about this feature is that you don’t need to manually combine the values to fill the cells. Instead, all you need to do is type a few letters representing the values, and Ms Excel will do the rest on its own!
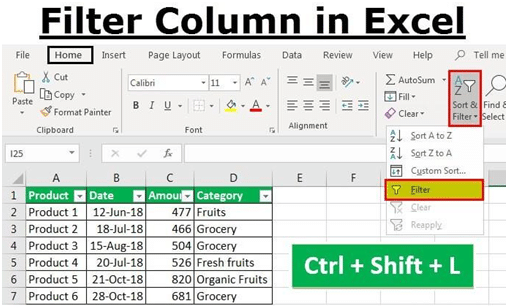
e. Filters
Excel is the most common office software used around the world. It has a ton of features that users need to learn and master. One feature that most users know is filtering data. Filters in MS Excel is an extension that helps users do many things like change data types, count and filter rows, sort and get totals. Excel has several filter options such as “count” or “sort”, but what if you look for something in between? What if you have 2,000 rows and only want to see the first 50? Again filtering the data is the solution.
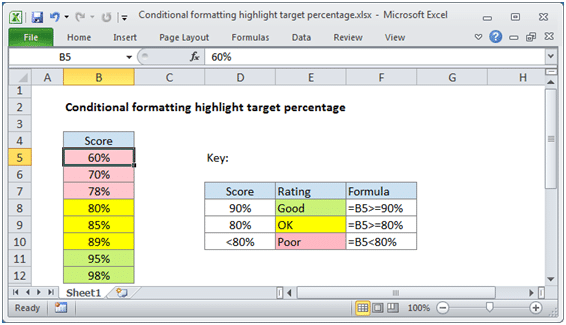
f. Know how data validation works for conditional formatting in Excel
One of the most common formats in Excel is conditional formatting. It lets you give a set of cells a different colour or pattern based on a condition that you specify. Sometimes, you might want to change the formatting for just one cell. You can do this by using data validation or conditional formatting in Excel. Data validation is an Excel function that lets you fill in specific criteria values and automatically apply them to all cells within the selected range. By default, data validation uses two methods:
- Cells contain values that meet the criteria.
- Cells do not contain values that meet the criteria.
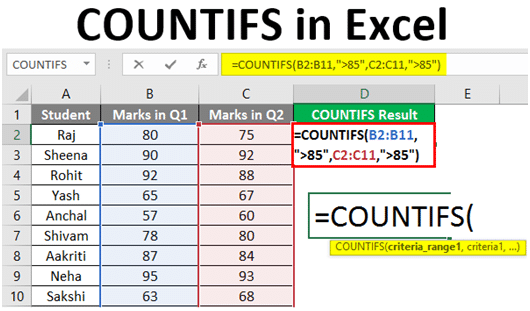
g. COUNTIF
The COUNTIF function in Excel is utilised to quickly find the number of cells in a given range that meet specific criteria. For example, if you want to count the number of cells greater than or less than a certain value, you can use the COUNTIFS function. The first argument for these two functions is a formula inside parentheses, which returns an array of values. The second argument is what you’re counting.
h. Be able to insert charts or graphs into an excel sheet.

Data Visualization is an important part of Excel. It helps the person see patterns, trends, and relationships in data. Data visualisation has been used in many industries and fields, including healthcare, finance, marketing, and business management.
The ability for a user to easily insert charts or graphs into an excel sheet makes it easy for the user to create powerful visualisations that help them make decisions. It’s also easy for the reader of an excel sheet to understand the information they are looking at because they can easily interpret it visually.
There are multiple ways in which you can insert charts into your spreadsheet. This includes inserting them through a button or using a macro. Unfortunately, it is not always convenient to embed charts into your excel sheet, and it’s also not easy to make the charts look beautiful and attractive.
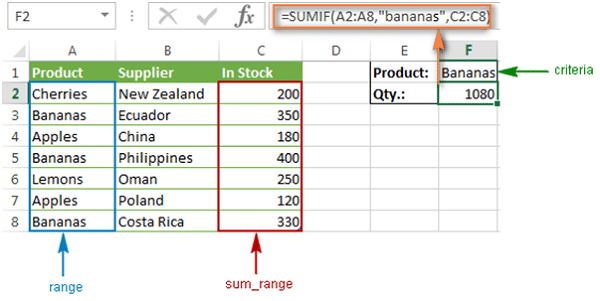
i. SUMIF
SUMIF is an Excel function that returns the sum of all cells in a range specified by the function. SUMIF can be used on columns, rows, or any combination of these. SUMIF is useful when there are many different ranges in a spreadsheet, and you want to add up the values of each column or row. It can also be utilised to calculate the sum for a range because this is not possible with Excel’s built-in functions.
j. IFERROR
One of the most vital formulas in Excel is IFERROR, as it helps prevent errors from happening by evaluating a formula’s result. IFERROR formula is one of the most important formulas in Excel. It prevents errors by evaluating a formula’s result and returning TRUE or FALSE. The IFERROR function in Excel is utilised to evaluate whether a formula evaluates to a value that is not valid.

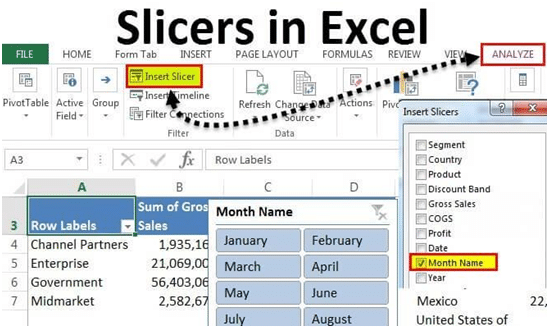
k. Slicers
Slicers are a feature of Microsoft Excel that lets you see two or more data sets side by side and compare them. You can use slicers in your Excel worksheet to present information in different ways so you can easily identify trends. For example, you could create a breakdown of income, product sales, and profit by region.
l. Sparkline
Sparklines are a series of vertical line graphs used to represent data with a single, easy-to-read chart. They function as miniature charts that allow users to quickly understand their data.
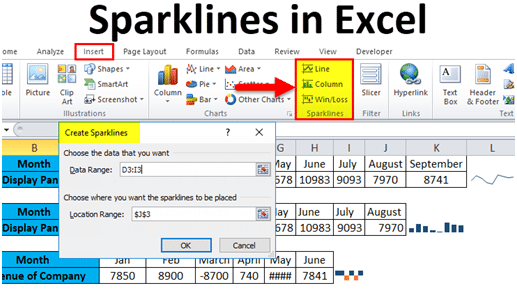
Sparklines help pull out the important trends and patterns in the data without getting distracted by less relevant information. Furthermore, they can be created by clicking on the Insert tab in Excel and filling in the chart template with different formulas.
Conclusion
With the increasing demand for Microsoft Excel skills in the IT industry, it is a great time to become an expert in Microsoft Excel. Microsoft Excel is one of the most widely used programming languages worldwide. It helps people with their work in accounting, engineering, and marketing. This skill set is not just limited to those in the field of data analysis and excel, as this skill set requires skills that can be applied across various industries.